We are proud to announce a new release for Event Masker, with many productivity tweaks and significant enhancements.
ES Integration
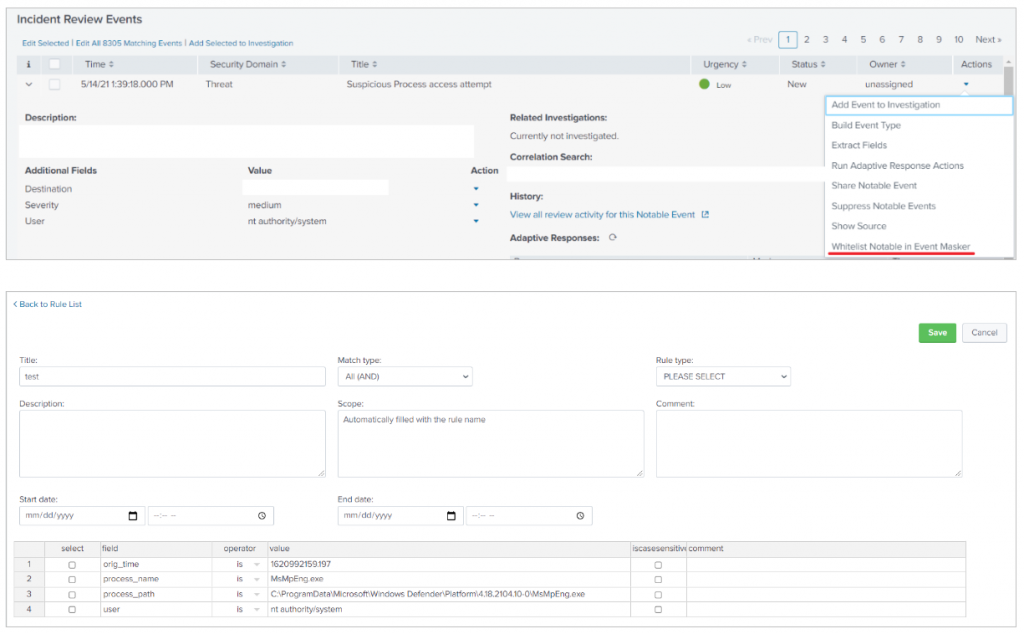
It was cumbersome to move from the tab where you had the notable event you wanted to mask, to the tab with Event Masker opened on the correct rule. That is why you may now create a mask rule directly from Splunk Enterprise Security Incident Review panel.
By selecting the Actions drop down menu and clicking on Whitelist Notable in Event Masker, you are directed to the rule creation page. The notable events fields are prefilled, as well as the scope and name of the rule, so it is easy for you to pick what you need. Tick the boxes, tweak the lines as you see fit, and that’s it! Don’t waste anymore time copy/pasting the values!
Validity Period Logic
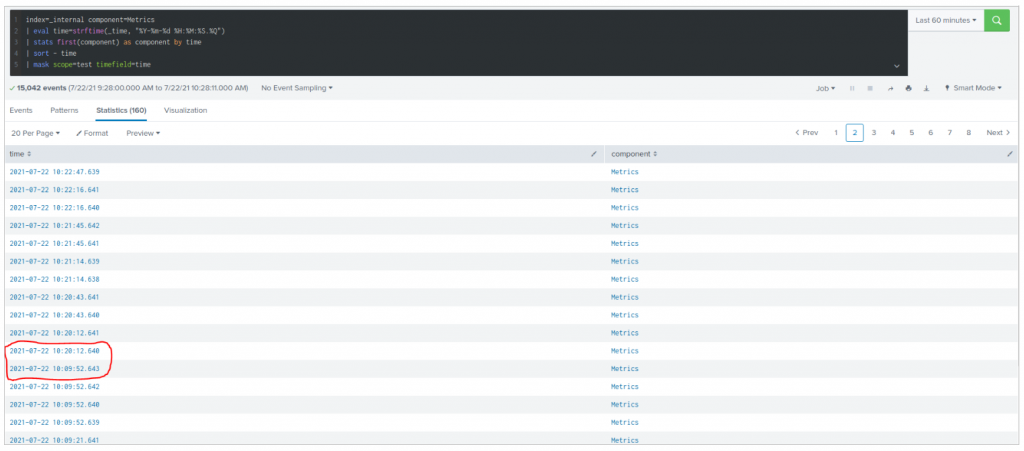
Event whitelisting based on timespan needed to be more flexible. Previously, we used the time of search to decide when to mask events. From now on, we use the generated time of the given events.
Also, we have seen that the _time field is not necessarily available at the moment you invoke the mask streaming command. Thus, we added the timefield argument to specify against which field you want time exclusions to be applied. For programmatic reasons, its format is %Y-%m-%d %H:%M:%S.%Q.
This enables, for instance, to mask a maintenance window where you see the same events again and again.
Below is an example of logs that are masked only between 10:10 AM and 10:20 AM:
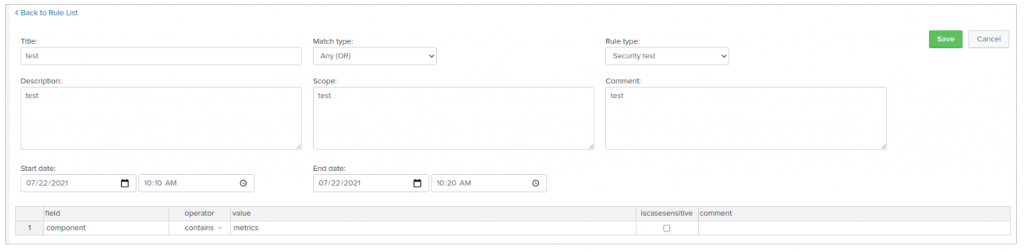
Revisited Interface
To ease your life, we moved all the parameters related to a rule on a single page. The rule properties are now above their conditions, to keep a simple and consistent view of what you are doing.

Customizable Rule Types
Want to classify you rules your way? The list of rule types is now based on a lookup table you may edit however you’d like. You may use the well known Splunk application Lookup Editor to update event_masker_rules_type_lookup.csv.
Detailed Comments
Imagine a rule with many hash values. With the new comment column available on every condition, you can explain what it actually means. This new field grants you unprecedented capability to document the rule at the best place of all!
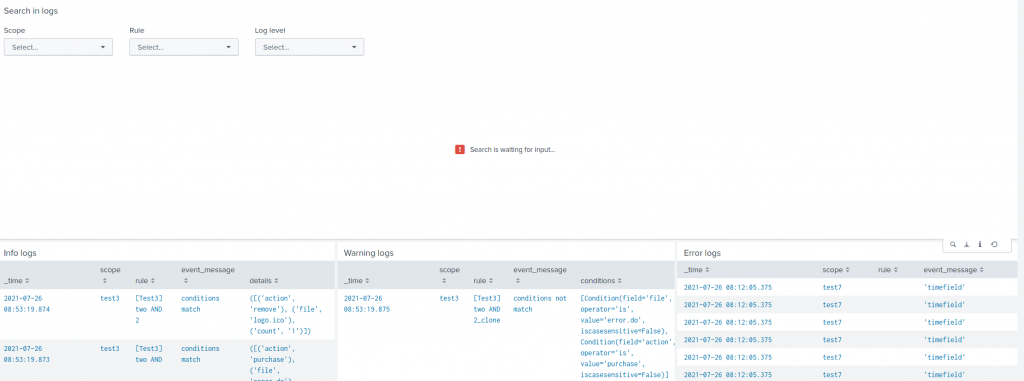
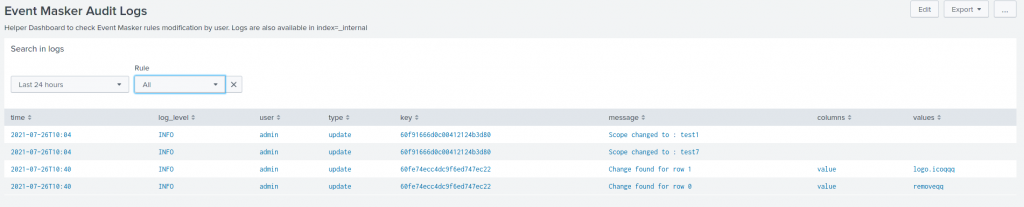
Dashboard and Logs
We extended the logs generated by the mask command and added logs for rule changes (currently, this feature requires write permission on _internals).
This enables new filters on existing dashboards. For instance, the mask command activity can be filtered by scope, rule title or log level.
From the rule list panel, you may jump to the logs to review all changes that occurred on this rule. We see a couple of use cases:
- troubleshooting regression implied by a recent change
- peer review of new whitelists
Hence, two new dashboards are available: Event Masker Logs for mask command, and Event Masker Audit Logs for rule logs. Isn’t it simple?
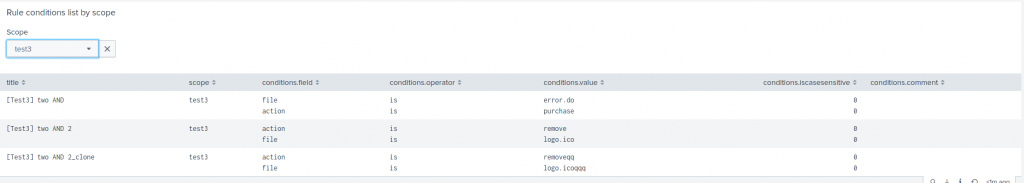
A new panel on Event Masker Overview shows all the rules and conditions for a given scope:
Default Permission
We updated default permission to add ess_user, ess_analyst and ess_admin roles to read the app content, and added ess_admin write capabilities.
Fetch the Update
You may find the app on:
- SplunkBase: https://splunkbase.splunk.com/app/5545/
- GitHub: https://github.com/scrt/event_masker/.
Feedback Welcomed!
We’d love hearing from you: what you achieved, what you think of it, the features you miss, and the unlikely bugs you found рЯШЙ You may reach us with GitHub issues or at the e-mail address provided in the readme.
Last but not least, a thunder applause for SCRT’s engineers whose commitment to excellence made this update possible!